Quantifying Correlation
In a recent work, I used the Pearson linear correlation coefficient, \rho, to describe the linear correlation between the radial velocity (RV) measurements and the S-values. I also made a chunk of code, named pearsonBootstrapPvalue.py, that calculates the p-value through a bootstrap Monte Carlo analysis.
These two pieces of code came in handy again for some recent work measuring the H-alpha spectral line for activity analysis, and checking for correlation with the RV measurements.
For the H-alpha analysis I was doing today, I wrote a few more lines to add the Pearson linear correlation coefficient and its associated p-value to an optional plot output.
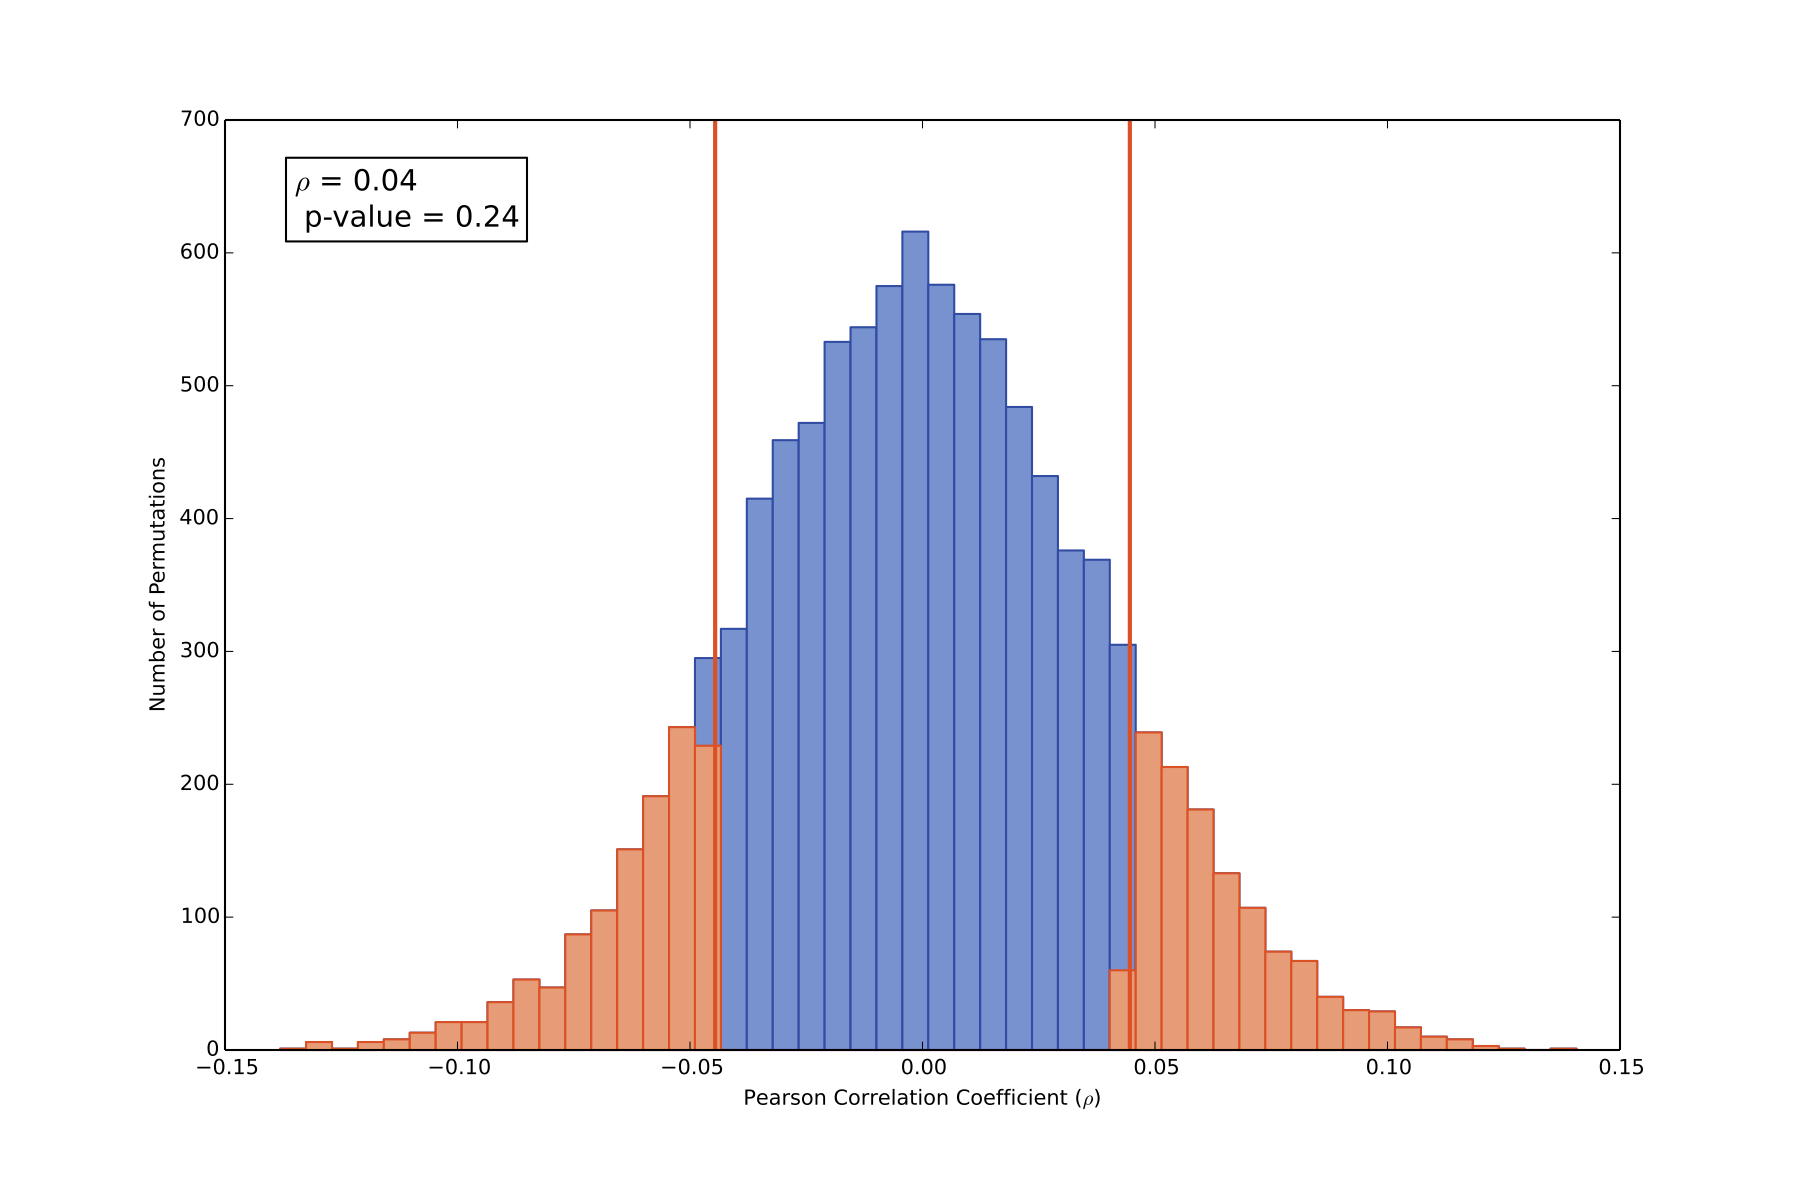
The figure above is the output from pearsonBootstrapPvalue.py. The blue bins show the distribution of bootstrapped p-values, the red lines show the calculated p-value of the unscrambled RV-Halpha data, and highlighted in salmon are the scrambled bootstrap permutations that are more extreme, i.e. show a more significant correlation or anti-correlation, than the unscrambled data set. Since a significant fraction of the scrambled permutations are more extreme than the unscrambled data set, there is no significant linear correlation in this data set.
If you’re interested in stellar activity, I should note that H-alpha equivalent widths in this data set were based on a 5 angstrom wide integration centered on the line center, and the line center was determined by fitting a parabola to the H-alpha line core. I attempted to fit H-alpha using many methods, and fitting the 5 A wide line resulted in one of the least significant correlations.